Market Focus for the week ending on October 25th 2024

A note from the author:

“Lorem ipsum dolor sit amet, consectetur adipiscing elit, sed do eiusmod tempor incididunt ut labore et dolore magna aliqua. Nisi scelerisque eu ultrices vitae auctor eu augue ut lectus. Aliquam ut porttitor leo a diam sollicitudin.“

Last Updated: October 28, 2024
By: Taylor Johnson

Market Focus for October 25th, 2024

Stocks reacted to rising U.S. Treasury yields, with the broad S&P 500 Index ending lower after six consecutive weeks of gains, influenced by expectations of a shallower Fed rate-cutting cycle. Large-cap stocks fared better than small- caps, and growth stocks outperformed value, with the tech-heavy Nasdaq Composite seeing modest gains. Tesla stood out as the top performer in the S&P 500 and among the “Magnificent Seven,” thanks to strong quarterly earnings and a positive sales outlook, which led to its best daily gain (22%) in over 11 years. In contrast, Apple weighed on the market after analysts downgraded their forecasts due to weaker sales projections for the iPhone 16.

DOW & TECH

THE DOW JONES INDUSTRIAL AVERAGE (DJIA) is the oldest continuing U.S. market index with over 100 years of history and is made up of 30 highly reputable “blue-chip” U.S. stocks (e.g. Coca-Cola Co., Microsoft).

The Dow ended the week down 2.68% at 42,114.40 vs the prior week of 43,275.91.

THE NASDAQ COMPOSITE INDEX tracks most of the stocks listed on the Nasdaq Stock Market – the second-largest stock exchange in the world. Over half of all stocks on the NASDAQ are tech stocks.

The tech-driven Nasdaq ended the week up 0.16%, closing at 18,518.61 vs. the prior week of 18,489.55.

LARGE, MEDIUM, & SMALL CAP

THE S&P 500 LARGE-CAP INDEX is a market-capitalization-weighted index of 500 leading publicly traded companies in the U.S. The S&P 500 is regarded as one of the best gauges of prominent American equities’ performance, and by extension, that of the stock market overall.

The S&P 500 ended the week down 0.96%, closing at 5808.12 compared to last week’s 5864.67.

THE S&P 400 MID-CAP INDEX is the benchmark index made up of 400 stocks that broadly represent companies with midrange market capitalization between $3.6 billion and $13.1 billion. It is used by investors as a gauge for market performance and directional trends in U.S. stocks.

The S&P 400 mid-cap ended the week down 2.84%, closing at 3107.51 compared to last week’s 3198.21.

THE RUSSELL 2000 (RUT) SMALL-CAP INDEX measures the performance of the 2,000 smaller companies included in the Russell 3000 Index. The Russell 2000 is managed by London’s FTSE Russell Group and is widely regarded as a leading indicator of the U.S. economy because of its focus on smaller companies that focus on the U.S. market.

The Russell 2000 ended the week down 2.99%, closing at 2207.99 compared to last week’s 2276.09.

U.S. COMMODITIES / FUTURES OVERVIEW

THIS WEEK’S ECONOMIC NEWS

Consumer spending up, jobless claims down:

In a light week for economic data, the Fed’s Beige Book reported minimal economic growth across most U.S. regions, noting a slight easing in worker demand and continued moderation in inflation. Despite the Beige Book’s lukewarm outlook, longer-term Treasury yields, which began rising in late September, continued their upward trend, with the 10-year U.S. Treasury yield reaching around 4.20%. Market expectations for Fed rate cuts decreased, anticipating 125 basis points of easing over the next year. Higher Treasury yields pushed tax-exempt municipal bond yields up, while primary issuance remained active. The investment-grade corporate bond market was weaker initially but stabilized, with lighter issuance and some oversubscription. High yield bonds declined amid macroeconomic challenges and higher yields, although the primary market remained active. It is worth noting that bank loans, benefiting from floating coupons, found technical support despite broader economic weaknesses.

Earnings Focus:

The 3rd Quarter 2024 earnings kicked off with 181 companies reporting earnings. Of the companies that have reported, 75% have reported earnings above analyst expectations. This is below the five but in line with the ten-year average of 77% and 75%. The projected Year over Year earnings growth rate for the S&P 500 is currently 4.4% while YOY revenue growth is 4.4%.When you examine the individual sectors, eight of the eleven sectors are estimated to report a year-over-year increase in earnings. The Technology and Communications sectors have the highest earnings growth rate for the quarter, while the Energy sector has the lowest anticipated growth compared to Q3 2013. The forward four-quarter P/E ratio of the S&P 500 is 21.9, which is above the thirty-year average. During the upcoming week, 169 S&P 500 companies (including 10 Dow 30 components) are scheduled to report results for the third quarter.

THIS WEEK’S HIGHLIGHTED STORY

What We’re Showing:

In 2024, the U.S. dollar has experienced notable depreciation against many major currencies due to anticipation of the Federal Reserve’s first rate cut since the onset of the COVID-19 pandemic (rates were cut by 0.5% in September 2024). Lower rates can reduce the dollar’s appeal relative to other currencies, particularly those in economies with higher interest rates.

Key Takeaways

From this dataset we can see that the U.S. dollar has depreciated the most against the Thai baht (THB), Polish złoty (PLN), and the Malaysian ringgit (MYR). At the other end of the scale, the U.S. dollar has appreciated the most against the Turkish lira (TRY) and the Mexican peso (MXN).

Pros and Cons of a Weaker U.S. Dollar

Here are some advantages of a weaker U.S. dollar:

Boosts U.S. exports: A weaker dollar makes U.S. goods and services cheaper abroad, which could help businesses in manufacturing and export-driven sectors. Increased tourism in the U.S. A weaker dollar could also attract more foreign tourists to the U.S., meaning more visitors to hotels, restaurants, and even national parks.

On the flipside, here are some disadvantages:

Costlier for Americans to travel: A weaker dollar means American tourist money doesn’t go as far in foreign countries (though it could be a good time to book that Mexico trip) More expensive imports: Goods that are manufactured abroad or rely on foreign parts may see price increases.

Subscribe to receive notifications about new content.

Other Newsletters

Newsletter Featured Content

More Content

Suggested Resources

Subscribe Now

Stay connected and get the latest content from Harvest.

Our resource library is one of the tools we use to stay connected with you.  Subscribe if you want to stay informed or have access to helpful tools and information.  Our team is at work cooking up new content for you regularly.  Don’t miss out!

Market Update for March 2023

Market Update

Do you know what effect inflation and the recent banking crisis might have on your investment portfolio?

To find out, watch the video below presented by Tim Newell, President of HIS Envoys Group.
In it, you will discover three important steps to managing risk in your investment portfolio and maintaining a stable mindset. In addition, Tim will walk through the recent banking crisis and a brief history of inflation, rising interest rates, and the Fed’s use of quantitative easing. Watch the video or read through Tim’s letter below the video.

What Is Happening With Inflation & Bank Failures

Over the past year, many have asked about inflation and how The Federal Reserve (the Fed) will control it. Additional concerns, such as Silicon Vally Bank’s and Signature Bank’s recent failures, have recently surfaced. As a result, you may be wondering what is going on, if your bank is secure, or what you should do.

The short video above will help you better understand the current state of inflation and the banking crisis in our nation. It explores how inflation today differs from the double-digit inflation caused by the problematic monetary policy of the 1970s and the differences in the strategies implemented to fight it.

In addition, we examine the implications of Quantitative Easing (QE), a strategy the Fed started using in 2008 and accelerated in 2020. This “money printing” campaign has now grown to over $8.6 trillion, heavily contributing to inflation’s rise to a 40-year high. Unfortunately, the Fed has continued QE over the last few weeks to prop up struggling banks’ falling values on their Treasury debt (bonds) because of rising interest rates.  

We realize these challenging times often lead to emotional decisions driven by fear. Take courage in 2 Timothy 1:7: “…for God gave us a spirit not of fear but of power and love and self-control.”

We at Envoy Financial believe that being a good steward of the resources God has entrusted us involves making sound decisions based on logic and reason rather than emotion. Therefore, we encourage you to watch this video. Then, click on the link below to schedule a meeting with one of our Stewardship Advisors, who can guide you through the maze of financial decisions in these uncertain times.

May God continue to bless you and your family. 

In His Service, 

Tim Newell, CFP, CKA, AIF

Speak with your Advisor

A Stewardship Advisor can help you evaluate risks in your financial portfolio.
Call (630) 613-9230 or schedule an online/phone meeting with one of Harvest’s licensed advisors.

Market Focus November 12th 2019

Highlights

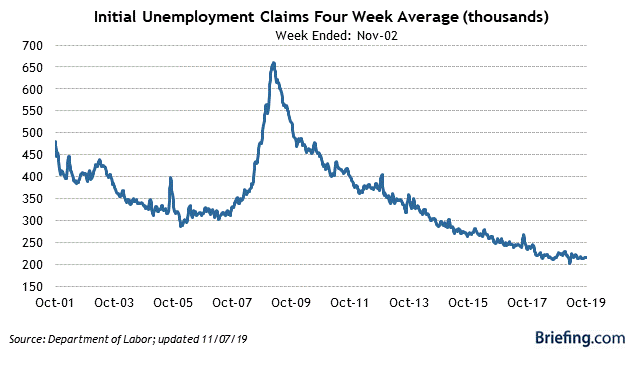
  • Initial jobless claims for the week ending November 2 decreased by 8,000 to 211,000 (Briefing.com consensus 217,000).
  • Continuing jobless claims for the week ending October 26 decreased by 3,000 to 1.689 million.

Key Factors

  • The four-week moving average for initial claims increased by 250 to 215,250.
  • The four-week moving average for continuing claims was unchanged at 1,686,750.
  • Initial claims have held below 300,000 for 244 straight weeks.

Big Picture

  • The key takeaway from the report is that it is consistent with a job market that remains on solid footing, which will keep recession concerns at bay.
Release Date Briefing.com
Case-Shiller 20-city Index January 26th 5.8%
Consumer Confidence January 26th 96.8
MBA Mortgage Index January 27th NA
FOMC Rate Decision January 27th 0.5%
Initial Claims January 28th 285k
GDP-Adv. January 29th 0.9%
Chicago PMI January 29th 45.0
Michigan Sentiment – Final January 29th 93.2

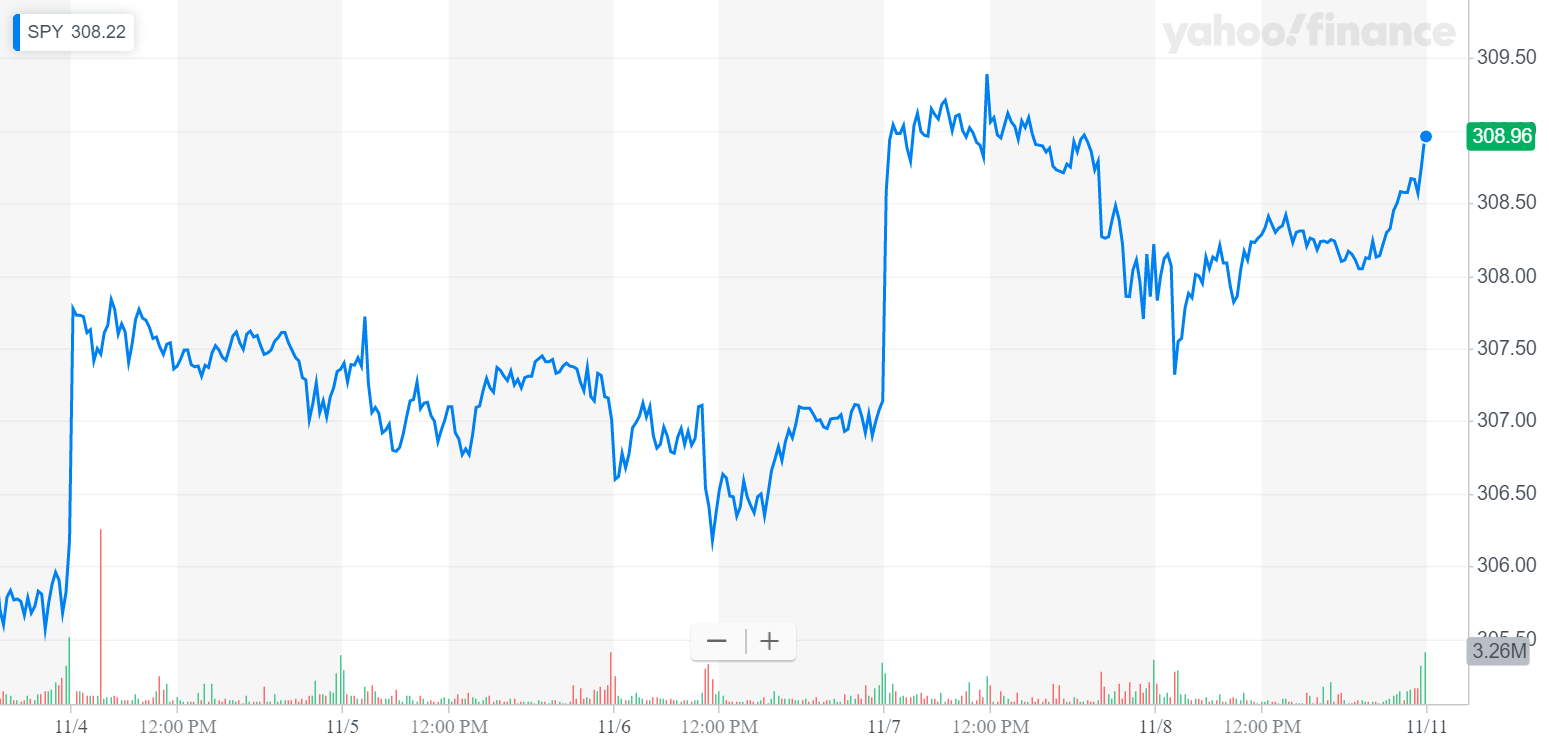
Market Focus November 11th 2019

In U.S. markets this week, a plunge on Wednesday took the major indexes down nearly 4% to levels not seen since early 2014. However, by late afternoon the markets had retraced a majority of the losses. Strong rallies on Thursday and Friday gave the indexes their first weekly gains of 2016, leading some to declare that “the bottom” had been seen.

Stocks rose last week for the first positive weekly performance in 2016, despite hitting new 52-week intraday lows last Wednesday. A rebound in oil and the promise of more QE from the ECB led to the oversold bounce Thursday/Friday. The S&P 500 rose 1.41% last week and is down 6.7% year to date. It started out ugly last week as markets followed oil lower both Tuesday and Wednesday, and ignored several pieces of “ok” data including in-line Chinese economic data and decent earnings from major banks including BAC, MS and GS. But, equities hit what appears to be a short-term inflection point midday Wednesday. Stocks broke through the August lows and then staged a decent rebound Wednesday afternoon thanks to a rally in oil, and importantly held support at 1,830 on a closing basis.

The two big events last week both occurred Thursday as ECB President Mario Draghi promised more QE in March, while in distillate inventories ignited a short squeeze in oil. Thursday’s gains were modest, but they made up for that modesty Friday as stocks surged on an oversold bounce that helped the market finish moderately positive on the week.