
Market Focus for the Week Ending on June 13th 2025
Stocks Down Over Middle East Tensions:
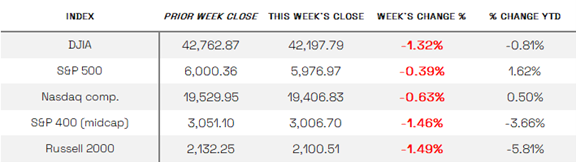
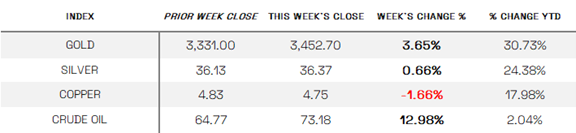
U.S. stocks reversed early gains and declined for the week amid escalating tensions in the Middle East. While markets were broadly higher through Thursday—bolstered by better-than-expected economic data and progress in U.S.-China trade talks, including the possibility of an extended tariff pause—sentiment soured on Friday following reports that Israel had launched airstrikes on Iranian nuclear facilities and military leaders, prompting a retaliatory response from Iran. This sharp escalation drove oil prices higher, lifting energy stocks but weighing heavily on broader indexes. The Dow Jones Industrial Average fell 1.32%, slipping back into negative territory for the year, while the S&P MidCap 400 and Russell 2000 dropped 1.46% and 1.49%, respectively; the S&P 500 and Nasdaq Composite declined more modestly but remained positive year-to-date.
DOW & TECH
THE DOW JONES INDUSTRIAL AVERAGE (DJIA) is the oldest continuing U.S. market index with over 100 years of history and is made up of 30 highly reputable “blue-chip” U.S. stocks (e.g. Coca-Cola Co., Microsoft).
The Dow ended the week down 1.32% at 42,197.79.
THE NASDAQ COMPOSITE INDEX tracks most of the stocks listed on the Nasdaq Stock Market – the second-largest stock exchange in the world. Over half of all stocks on the NASDAQ are tech stocks.
The tech-driven Nasdaq ended the week down 0.63%, closing at 19,406.83.
LARGE, MEDIUM, & SMALL CAP
THE S&P 500 LARGE-CAP INDEX is a market-capitalization-weighted index of 500 leading publicly traded companies in the U.S. The S&P 500 is regarded as one of the best gauges of prominent American equities’ performance, and by extension, that of the stock market overall.
The S&P 500 ended the week down 0.39%, closing at 5,976.97.
THE S&P 400 MID-CAP INDEX is the benchmark index made up of 400 stocks that broadly represent companies with midrange market capitalization between $3.6 billion and $13.1 billion. It is used by investors as a gauge for market performance and directional trends in U.S. stocks.
The S&P 400 mid-cap ended the week down 1.46%.
THE RUSSELL 2000 (RUT) SMALL-CAP INDEX measures the performance of the 2,000 smaller companies included in the Russell 3000 Index. The Russell 2000 is managed by London’s FTSE Russell Group and is widely regarded as a leading indicator of the U.S. economy because of its focus on smaller companies that focus on the U.S. market.
The Russell 2000 ended the week down 1.49%.
U.S. COMMODITIES / FUTURES OVERVIEW
THIS WEEK’S ECONOMIC NEWS
Labor Market Cooling Signs:
New jobless claims jumped to 242,000 last week, the highest in nearly 10 months, while the four-week average rose to 227,000. This suggests a gradual softening of the labor market. The University of Michigan’s preliminary consumer sentiment index also dropped to 65.6 — a seven-month low — on concerns about inflation and interest rates. Investors are now more closely watching for signs that could influence Fed policy decisions at the June meeting.
Earnings Focus:
The 1st Quarter 2025 earnings reporting season is nearly complete, with 99% or 497 companies having reported results. Of these, 76% have reported earnings above analyst expectations — in line with the 5- and 10-year averages of 77% and 75%. The blended year-over-year earnings growth rate for the S&P 500 stands at 13.7%, while revenue growth is tracking at 5.0%.
At the sector level, 8 of the 11 sectors have reported positive earnings growth, led by Communication Services and Health Care. Energy posted the largest decline relative to Q1 2024. The forward four-quarter P/E ratio for the S&P 500 is now 22.4, which remains above the 10- and 30-year historical averages.
Looking ahead, just 1 S&P 500 company is scheduled to report Q1 results next week, and 5 companies are expected to report for Q2.
THIS WEEK’S HIGHLIGHTED STORY
https://www.visualcapitalist.com/how-big-is-bitcoin-compared-to-the-worlds-largest-companies/
June 13, 2025
What We’re Showing:
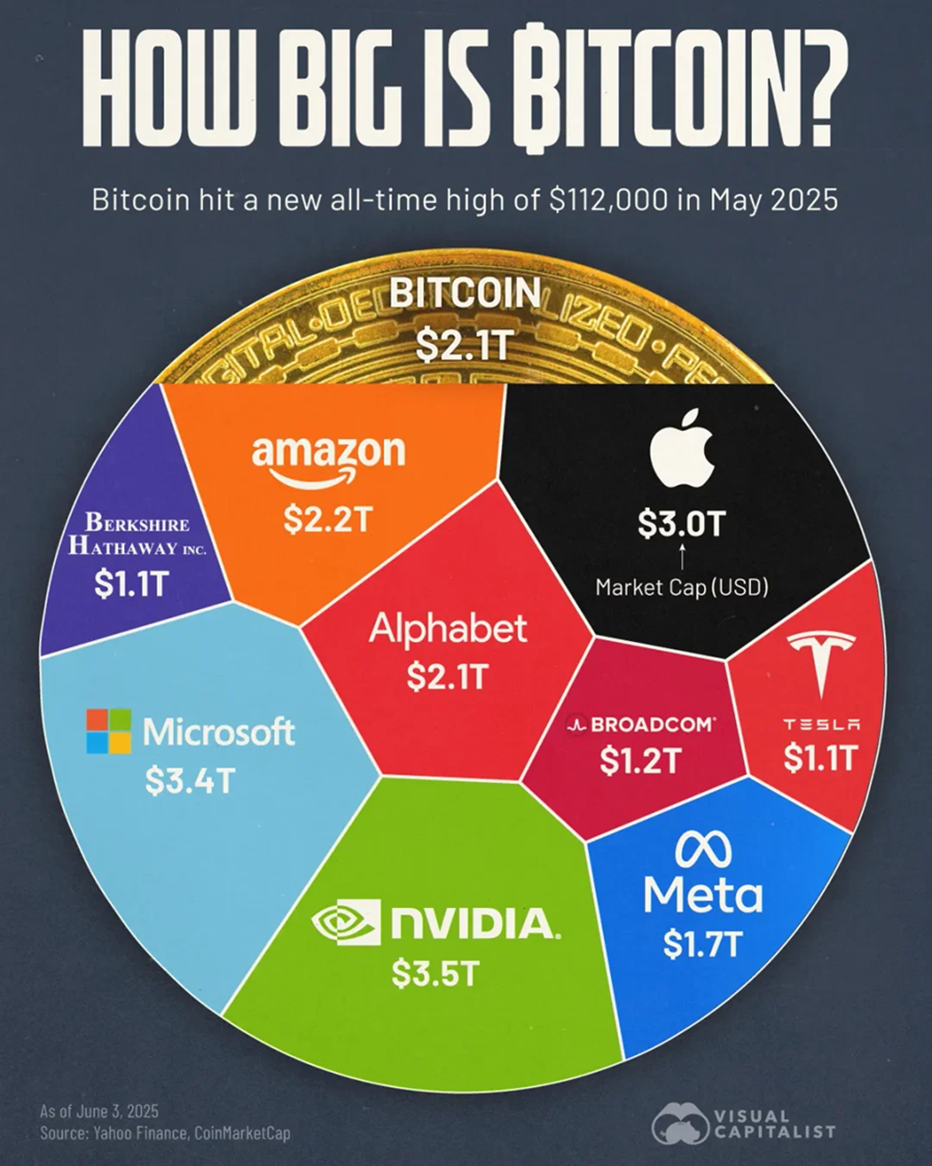
Bitcoin reached its all-time high of $111,814 in May, marking a significant milestone in its price history. The infographic above compares Bitcoin’s valuation to the largest publicly-traded companies, highlighting its new position among global titans. The cryptocurrency now sits comfortably in the top five assets by market cap. The data for this visualization comes from CoinMarketCap and Yahoo Finance. It ranks the largest companies and bitcoin by market capitalization as of June 2025.
Key Takeaways:
Bitcoin has overtaken big names like Meta and Tesla and is now valued at $2.1 trillion compared, similar to Alphabet’s valuation. The rise follows renewed interest from institutions and political momentum behind crypto legislation. President Trump’s backing of a stablecoin bill has been a notable tailwind for digital assets in 2025.
Tech firms account for eight of the ten largest assets globally, including Microsoft, Apple, Amazon, and Meta. Even Tesla and Broadcom, though smaller, maintain trillion-dollar valuations.
Nvidia is the most valuable company in the world, with a $3.5 trillion market cap. Its dominance reflects the ongoing AI boom and investor enthusiasm around high-performance computing. Currently, Nvidia’s chips are central to nearly all major AI innovations, giving it a crucial edge over competitors.
.
Sources:
All index and returns data from Norgate Data and Commodity Systems Incorporated and Wall Street Journal
W E Sherman & Co., LLC. W E Sherman & Co., LLC. News from Reuters, Barron’s, Wall St. Journal, Bloomberg.com, ft.com, guggenheimpartners.com, zerohedge.com, ritholtz.com, markit.com, financialpost.com, Eurostat, Statistics Canada, Yahoo! Finance, stocksandnews.com, marketwatch.com, visualcapitalist.com, wantchinatimes.com, BBC, 361capital.com, pensionpartners.com, cnbc.com, FactSet, Morningstar/Ibbotson Associates, Corporate Finance Institute. LSEG I/B/E/S, Factset Earnings Insigh
Commentary from T Rowe Price Global markets weekly update — https://www.troweprice.com/personal-investing/resources/insights/global-markets-weekly-update
This report is provided for informational purposes only. This report does not constitute an offer to sell or a solicitation or an offer to buy any securities. Any reference to a specific security included in this report does not constitute a recommendation to buy, sell or hold that security. Consult with your advisor for advice. All investments involve risk, including loss of principal. Principal values and investments returns are neither guaranteed nor issued by, guaranteed by, or obligations of a bank, savings and loan, or credit union; and are not insured or guaranteed by the FDIC, SIPC, NCUSIF or any other agency. Advisory Services offered through Harvest Investment Services, LLC, a Registered Investment Advisor.


